monthly_temps <- read_csv("monthly_global_land_and_ocean_temperature_anomalies.csv")
## Parsed with column specification:
## cols(
##   YearMonth = col_double(),
##   Value = col_double()
## )
#reads in data file

monthly_temps <- mutate(monthly_temps, month_number = row_number())
#create new variable recording the row of each entry - corresponds to the month of the data

monthly_temps <- mutate(monthly_temps, date = ymd(YearMonth, truncated=1))
#converts integer date to a Date date - truncated=1 because in ymd format, but no day is included

monthly_temps <- mutate(monthly_temps,
                        year=year(date),
                        month=month(date,label=TRUE))
#extracts year and month from date and stores them as separate variables, saves month as name, not number

monthly_temps <- rename(monthly_temps, temperature_anomaly = Value)
#renames Value variable "temperature_anomaly"

monthly_temps <- select(monthly_temps, -YearMonth)
#removes "YearMonth" variable. as it has been replaced by the date variable

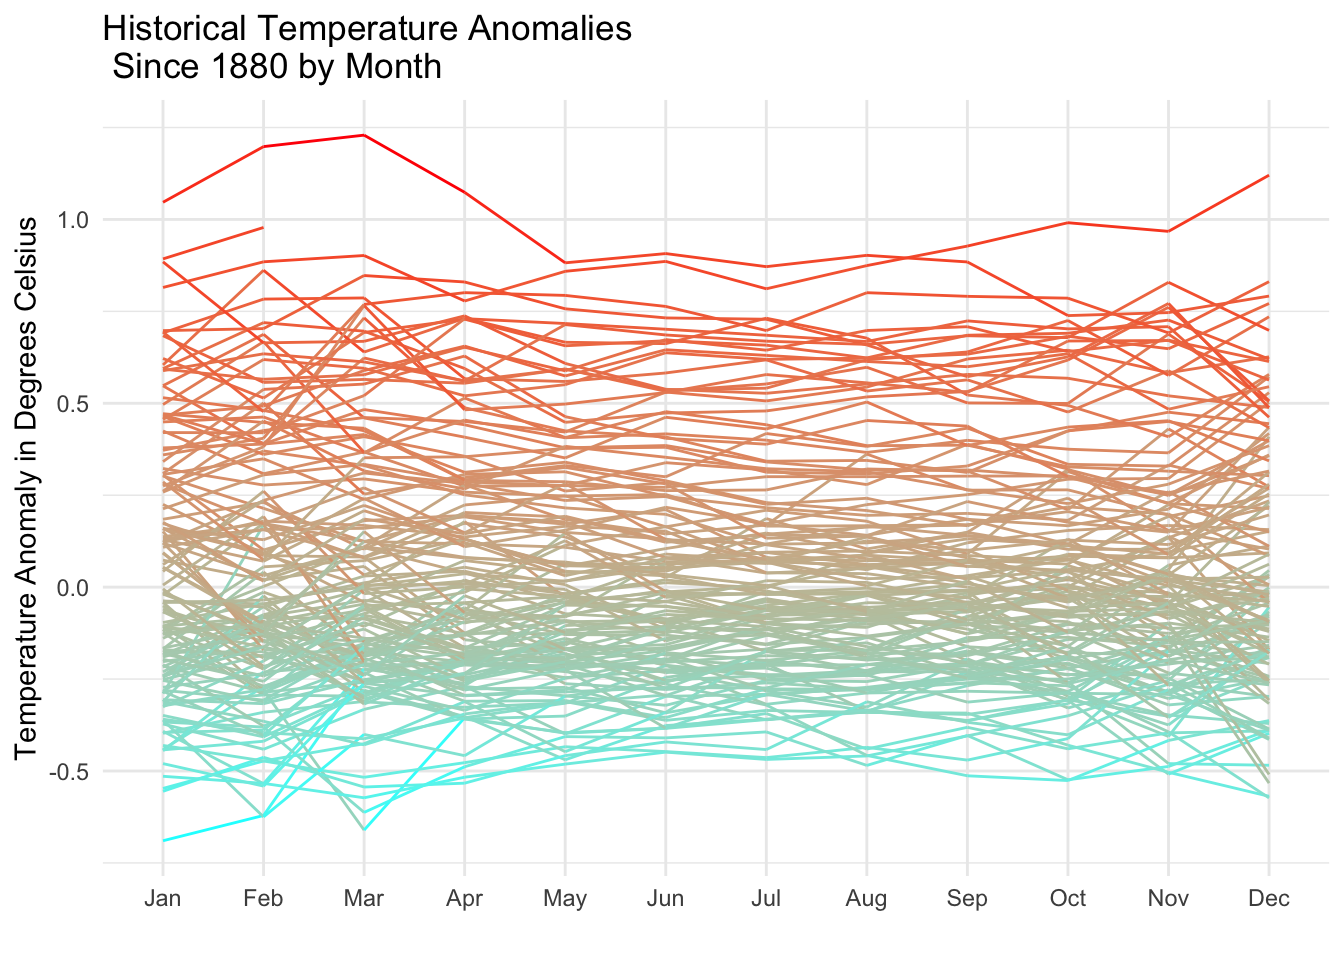
ggplot(monthly_temps, aes(month(date, label=TRUE),
                          temperature_anomaly,group=year
                          ))+
  geom_line(aes(color=temperature_anomaly), show.legend = FALSE)+
  theme_minimal()+
  scale_color_gradientn(colors=rev(rainbow(2)))+
  labs(y="Temperature Anomaly in Degrees Celsius",
       x="",title = "Historical Temperature Anomalies \n Since 1880 by Month")

save(monthly_temps, file="climate_data.RData")
